

Hosting apps on the iOS App Store is tied to a developer account with an annual fee of $99. Every year by this time I need to decide whether it is still worth keeping it. Cancelling the account means that the apps hosted through the account get removed from the App Store.
If it wasn’t for nostalgia, I would have closed down the account a couple of years ago. At the moment I have a single app in the Store based on the outcome of my PhD thesis. The Health-Optimal Route Planner demonstrates one of many interesting use cases enabled by high-resolution urban air pollution maps. The app computes and displays the healthiest route between any two locations in the city of Zurich. Further, it compares it to the shortest route between the two given locations.


The app itself, while being a nice use case demonstrator, has limited use for the general public. The high-resolution pollution map needed to implement the use case is only available for the city of Zurich. It comes at no surprise that the number of app installations is very small. Since its release in September 2014 there were a total of 554 downloads until this summer, with a small peak in the early days when a local newspaper wrote a story about it.
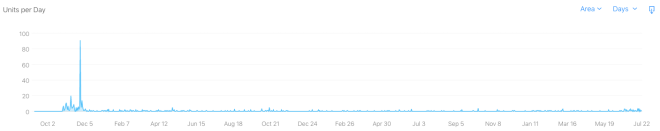
Having the app not updated for the last 2.5 years, I decided to have a last glimpse on the statistics before closing down the developer account. And rather surprising the numbers changed. Since this August the application gets installed around 60 times a day.
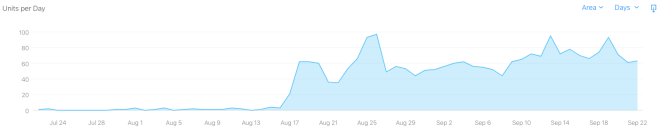
This does not make any sense. As mentioned above, the app’s value is limited to a small geographic region, having this amount of downloads from the region of Zurich is difficult to imagine. Hence, let’s have a look at the geographic distribution of the installations in the last two months.
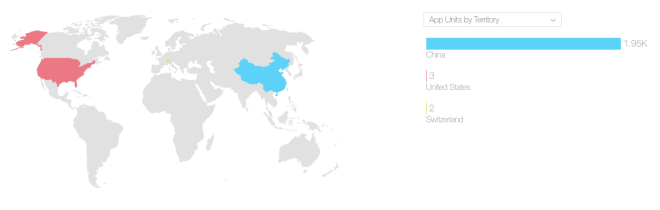
This even makes less sense. The vast majority of installations is originating from China. Being curious, the next question that popped up was whether the app is just installed by some random service or whether there are real users behind it. The app itself does not track any user interaction. But since it makes use of the Google Places and Maps APIs and Google sets limits on the number of requests before charging for them, the number of requests are logged and can be analyzed. The Places API gets a request if a user enters the location she wants to use to compute the optimal route. Only if the user specifies a valid (needs to be within the city of Zurich) start and end locations and hits the Compute route button the Maps API is used to illustrate the routes computed. The stats show the following number of request in past days.
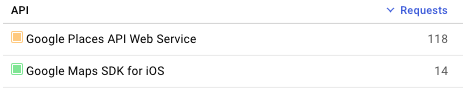
It seems that some of the users are trying to use the app by entering a location. But only a tiny subset results in an actual route computation indicating that most users would like to query a location not supported by the app.
The question remains. What is the reason for the app’s popularity in China? I don’t know, but I would be very curious to find out! By the way, the download statistic of the Android version of the app did not increase in the same time period.
